 John Coogan
Entrepreneur
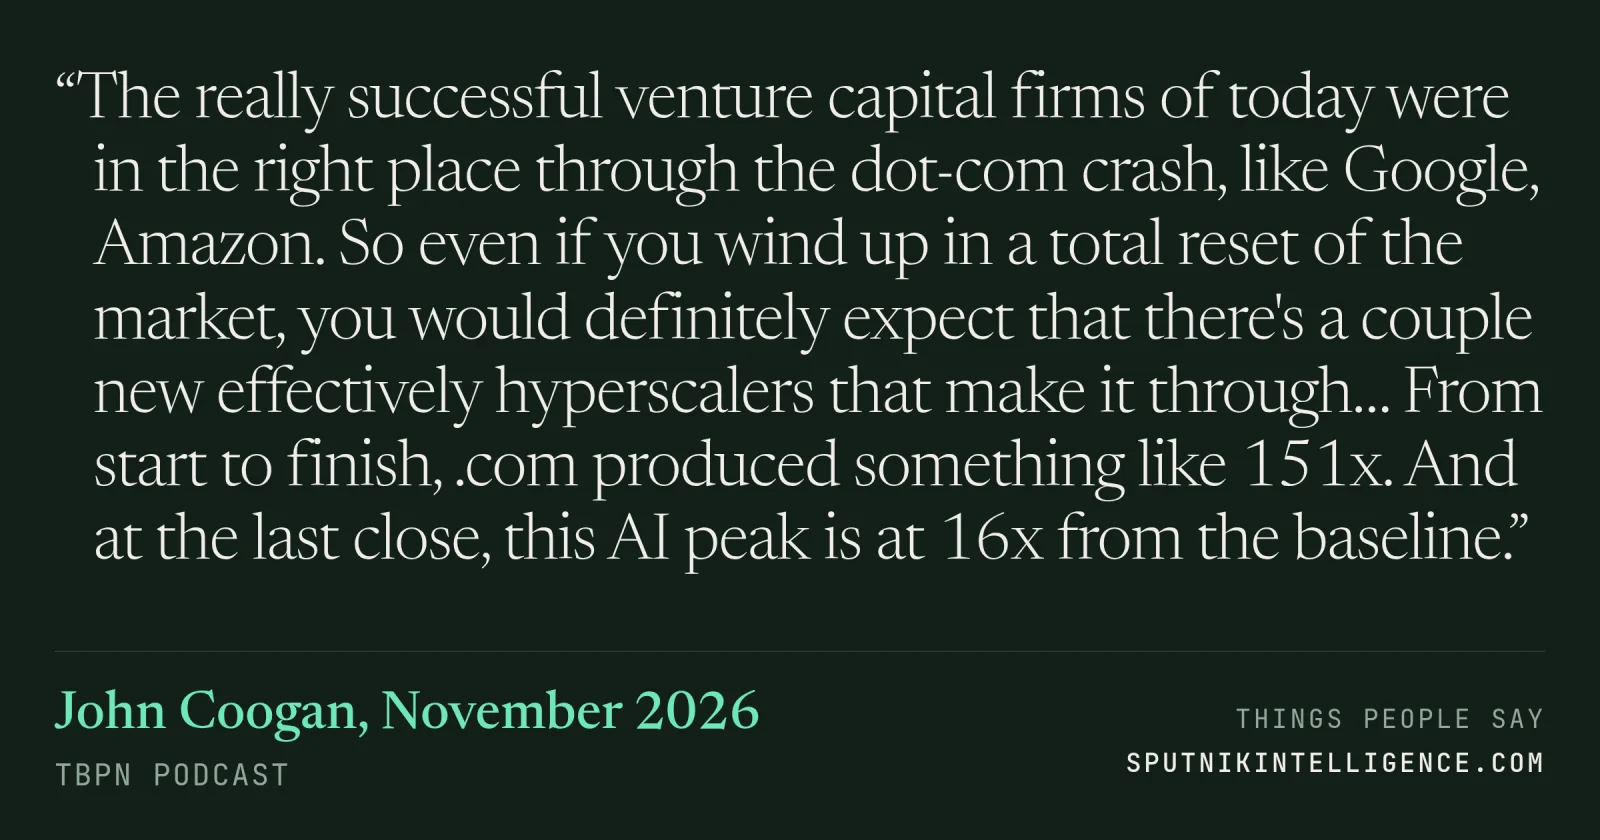
“The really successful venture capital firms of today were in the right place through the dot-com crash, like Google, Amazon. So even if you wind up in a total reset of the market, you would definitely expect that there's a couple new effectively hyperscalers that make it through… From start to finish, .com produced something like 151x. And at the last close, this AI peak is at 16x from the baseline.”
TBPN · Startups & Venture · November 2026
Context
After the post-midterm tech sell-off, the hosts were weighing whether this resembles the dot-com bust. John described a chart overlaying the dot-com run with the AI run, noting the dot-com peak went far higher.
Transcript
Showed that it's possible.
…individual was basically saying, like, we're entering the era of stock picking. Oh, yeah. You could basically just buy anything over the last year or two Yeah. And do quite well. And maybe it's time to buy the dip because almost everything is traded down. Yeah. But you gotta pick the right ones.
Yeah. I mean, that that that was the same... Like, the stories that we tell about the storied tech firms, the the really successful venture capital firms of today, all were in, no coincidence, like Google, Amazon. Right? They were in the right place through the dot com crash. So even if you wind up in a total reset of the market, you would definitely expect that there's a couple new effectively hyperscalers that make it through. Daniel Newman had this very interesting visualization of .com versus AI. Tracks very closely and then gets crazy at the end. Let's pull this video up. Let's pull up .com versus AI. It looks identical for a minute. And .com there is on the top, the orange line, doing well, crossing. They're going back and forth, going back and forth. And then here we are today with a sell off, and then .com keeps ripping. Look at that. So from start to finish,.com produced something like 151 x. And at the last close, this AI peak is at 16 x from the baseline. Depends on where you start the baseline, but...
Jobs. We gotta talk about jobs.
Let's talk about jobs.
Geiger says jobs in October came in higher than all 80 forecasters in Bloomberg survey predicted.
More from TBPN